If you need to show how different parts of a system talk to each other over time, a sequence diagram is one of the clearest ways to do it. And when you write that diagram as code using PlantUML, you get a version-controlled, easy-to-edit visual that doesn't require a drag-and-drop tool. Whether you're documenting an API flow, explaining a login process, or mapping out microservice communication, knowing how to write PlantUML code for a sequence diagram saves time and reduces confusion in your team.
What does a PlantUML sequence diagram actually look like?
A sequence diagram in PlantUML uses a simple text-based syntax. You define participants (the actors or systems involved), then describe the messages exchanged between them. Here's a basic example:
@startuml
actor User
participant "Web Server" as Server
participant "Database" as DB
User -> Server: Send login request
Server -> DB: Query user credentials
DB --> Server: Return user data
Server --> User: Display dashboard
@enduml
This renders a diagram with three participants and four messages flowing between them. The arrow style matters: -> draws a solid arrow (synchronous call), while --> draws a dashed arrow (return/response).
How do you add participants in PlantUML sequence diagrams?
You declare participants at the top of your diagram. PlantUML supports several keyword types depending on what you want to represent:
actorfor human users, rendered as a stick figureparticipantfor systems, services, or componentsdatabasefor database entities, shown with a cylinder iconqueuefor message queuesentity,control,boundaryfor UML object stereotypes
You can also rename participants using the as keyword. For example, participant "Authentication Service" as Auth lets you refer to it as Auth in your message lines. This keeps your code clean, especially in diagrams with long service names.
How do you show different types of messages?
PlantUML uses arrow syntax to distinguish message types. Here's what the common patterns mean:
A -> B: messagesolid arrow, synchronous messageA --> B: messagedashed arrow, return messageA ->> B: messageopen arrowhead, asynchronous messageA ->o B: messagearrow with an open circle at the endA o--o B: messagedashed line with circles on both ends
For most diagrams, the solid arrow and dashed arrow combination covers the majority of real-world flows. Use asynchronous arrows when a system sends a message and doesn't wait for an immediate response.
How do you add loops, conditions, and alternative blocks?
Real-world interactions rarely follow a straight line. PlantUML supports several grouping constructs that map directly to UML interaction fragments:
altalternative paths (like if/else)optoptional execution (single condition)looprepeated behaviorparparallel executionbreakbreak out of a loopcriticalatomic operation that must complete
Here's an example that uses a conditional block:
@startuml
actor User
participant Server
participant "Auth Service" as Auth
User -> Server: Submit credentials
Server -> Auth: Validate token
alt Token is valid
Auth --> Server: 200 OK
Server --> User: Show dashboard
else Token is expired
Auth --> Server: 401 Unauthorized
Server --> User: Redirect to login
end
@enduml
The alt block renders as a combined fragment with two separated regions labeled with the conditions you provide.
How do you add notes and activation bars?
Notes give context to specific messages or participants. Activation bars (also called focus of control) show when a participant is actively processing something.
@startuml
participant Server
participant DB
Server -> DB: SELECT FROM users
activate DB
note right of DB: Querying user table
DB --> Server: Result set
deactivate DB
@enduml
You can place notes on the left, right, or over a participant. Activation bars are optional but make diagrams easier to read when you have multiple overlapping interactions.
Can you reference other diagrams in a PlantUML project?
Absolutely. If your system involves complex interactions, you might split documentation across multiple diagram types. For example, a deployment overview might live in a PlantUML deployment diagram showing your cloud architecture, while the sequence diagram covers the message flow within that architecture. Similarly, if your flow involves state transitions like an order moving from "pending" to "confirmed" you could link readers to a state machine diagram for real-time systems for deeper detail.
What are common mistakes when writing PlantUML sequence diagrams?
Several issues come up frequently, especially when people are new to the syntax:
- Forgetting the
@endumltag. Every PlantUML diagram needs an opening and closing tag. Without it, the diagram won't render. - Using the wrong arrow type. Mixing up
->and-->can misrepresent whether a call is synchronous or a response. Review your arrows before sharing. - Not aliasing long names. Typing
"Content Delivery Network"on every message line gets messy. Useas CDNafter declaring the participant. - Overcrowding the diagram. If you have 12+ participants with dozens of messages, break it into multiple diagrams. One diagram per user flow or use case is a good rule of thumb.
- Mismatched
endtags. Everyalt,loop,opt, orparblock needs a correspondingend. PlantUML will throw rendering errors if they're off.
How do you handle advanced features like groupings and references?
PlantUML supports a ref over construct that lets you reference another sequence diagram within your current one. This is useful for large systems where authentication or error handling flows are reusable.
ref over Auth: Authentication flow
You can also add dividers to separate logical sections:
== Step 1: Initial Request ==
This renders a horizontal line with the label, helping readers visually break the diagram into stages.
Where can you render PlantUML sequence diagrams?
You have several options for turning your PlantUML text into images:
- PlantUML Online Server paste your code and get an instant render
- VS Code extensions preview diagrams directly in your editor
- IntelliJ IDEA plugin integrated diagram preview for JetBrains IDEs
- Command line generate PNG, SVG, or PDF files from
.pumlfiles - CI/CD pipelines auto-generate diagrams on every commit using PlantUML's Docker image
For teams that keep diagrams in the same repo as their code, rendering in CI ensures documentation stays in sync with changes.
Quick checklist before sharing your sequence diagram
Run through these points before you commit or share your diagram:
- Every
@startumlhas a matching@enduml - Participants are aliased for readability where names are long
- Arrow types accurately represent synchronous, asynchronous, and return messages
- Grouping blocks (
alt,loop, etc.) are properly closed withend - The diagram covers one clear flow not the entire system at once
- Notes are used sparingly to add context, not clutter
- You've rendered the diagram locally and confirmed it looks correct before pushing
Start with one user story or API call, write the interaction step by step, and build outward from there. You can always explore more sequence diagram code examples as your needs grow. The syntax is simple enough that the best way to learn is to write, render, and iterate.
 Plantuml Class Diagram Syntax and Implementation Examples
 Plantuml Deployment Diagram Code for Cloud Architecture Examples
 Plantuml State Machine Diagram Example for Real-Time Systems
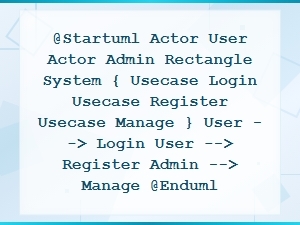 Plantuml Use Case Diagram Code Snippet Examples
 E-Commerce Website Database Schema Diagram Example with Tables and Relationships
 Beginner's Guide to Graphviz Dot Language Syntax