When you need to show how your application components live across AWS, Azure, or any cloud provider, a plain text diagram beats a slide deck every time. PlantUML deployment diagram code for cloud architecture lets you define servers, containers, load balancers, and networks in simple text then renders a clear visual. You can version-control it, share it in pull requests, and update it without opening a design tool. That's why developers, DevOps engineers, and solutions architects keep reaching for PlantUML when they need to map out cloud infrastructure.
What does a PlantUML deployment diagram actually represent?
A deployment diagram in PlantUML shows the physical or virtual nodes in your system and the artifacts that run on them. In a cloud context, nodes are things like EC2 instances, Lambda functions, RDS databases, S3 buckets, or Kubernetes pods. Artifacts are the JAR files, Docker images, or configuration packages deployed to those nodes. Connections between nodes represent communication paths HTTP, gRPC, message queues, or VPN tunnels.
The syntax uses keywords like node, cloud, database, and artifact to describe your infrastructure hierarchy. You nest nodes inside other nodes to show containment, and you draw arrows to show data flow or dependencies.
How do you write basic PlantUML deployment diagram code for cloud architecture?
Here's a straightforward example targeting an AWS-style setup:
@startuml

skinparam backgroundColor #FEFEFE

skinparam shadowing false


cloud "AWS Cloud" {

  node "VPC" {

    node "Public Subnet" {

      node "Application Load Balancer" as alb

    }

    node "Private Subnet" {

      node "EC2 Instance" as ec2 {

        artifact "Spring Boot App" as app

      }

      database "RDS PostgreSQL" as rds

    }

  }

}


alb --> ec2 : HTTPS

ec2 --> rds : JDBC

@enduml
This code produces a diagram showing traffic entering through a load balancer, hitting an EC2 instance running a Spring Boot app, and that app connecting to a PostgreSQL database. The nesting clearly shows which resources live inside which subnet.
What are the key PlantUML elements for cloud diagrams?
These are the most common elements you'll use when modeling cloud infrastructure:
- node represents a compute resource like a VM, container host, or server
- cloud represents a cloud provider boundary (AWS, GCP, Azure)
- database represents a data store (RDS, DynamoDB, Cosmos DB)
- artifact represents a deployable unit (Docker image, WAR file, ZIP bundle)
- component represents a logical service or microservice
- queue represents messaging systems (SQS, RabbitMQ, Kafka)
You can also use package to group related services and together to keep related nodes visually clustered.
How do you model a multi-region or multi-cloud setup?
For multi-region architectures, you create separate cloud or node blocks for each region and draw connections between them. Here's an example:
@startuml

skinparam backgroundColor #FEFEFE


cloud "AWS us-east-1" {

  node "EKS Cluster" as eks1 {

    component "API Service" as api1

    component "Worker Service" as worker1

  }

  database "RDS Primary" as db_primary

}


cloud "AWS eu-west-1" {

  node "EKS Cluster" as eks2 {

    component "API Service" as api2

    component "Worker Service" as worker2

  }

  database "RDS Replica" as db_replica

}


api1 --> api2 : Cross-region sync

db_primary --> db_replica : Replication

@enduml
This shows two regional clusters with database replication between them. If you're working across providers say AWS for compute and GCP for BigQuery you'd use separate cloud blocks and label the connection types explicitly.
When should you use a deployment diagram instead of other diagram types?
Use a deployment diagram when the question is "where does this run?" or "how do these servers connect?" If you're explaining who uses the system and what they do, a use case diagram fits better, and you can find practical examples of writing use case diagrams in PlantUML. If you're describing how a single component changes state under different conditions, a state machine diagram is the right tool like these state machine examples for real-time systems.
Deployment diagrams specifically answer infrastructure questions: What servers exist? What runs on each one? How do they communicate? If your audience is ops, SRE, or a solutions architect reviewing your design, this is the diagram type they need.
How do you add networking details like subnets, firewalls, and load balancers?
PlantUML doesn't have built-in firewall or security group notation, but you can represent them cleanly using stereotypes and notes:
@startuml
skinparam backgroundColor #FEFEFE
cloud "AWS" {
node "VPC 10.0.0.0/16" {
node "Public Subnet 10.0.1.0/24" <
node "ALB" as alb
}
node "Private Subnet 10.0.2.0/24" <
node "App Server" as app
}
node "Data Subnet 10.0.3.0/24" <
database "Aurora MySQL" as aurora
}
}
}
note right of alb
Security Group: allow 443 inbound
end note
alb -[#green]-> app : Port 8080
app -[#blue]-> aurora : Port 3306
@enduml
Stereotypes like <<rectangle>> change the shape of nodes. Color-coded arrows distinguish traffic types. Notes attached to specific elements explain security rules, ports, or CIDR ranges that the diagram symbols alone can't show.
What common mistakes do people make with PlantUML cloud deployment diagrams?
Overloading a single diagram. Trying to show every microservice, every database table, and every CI/CD pipeline in one diagram makes it unreadable. Split into logical views an infrastructure view, a networking view, and a data flow view.
Using inconsistent naming. If you call a service "api-gateway" in one diagram and "API Gateway" or "apigw" in another, readers get confused. Settle on a naming convention early.
Skipping the legend. If you use colored arrows or custom stereotypes, add a legend. Without it, people guess what the colors mean.
Ignoring the audience. A diagram for a security review should highlight firewalls, encryption, and access controls. A diagram for a developer onboarding session should show which repos deploy to which environments. Adjust detail based on who reads it.
Not versioning the code. The whole point of text-based diagrams is that they live in Git alongside your infrastructure-as-code. If you keep your .puml files outside your repo, you lose the ability to track infrastructure changes alongside the diagrams that describe them.
How do you render PlantUML cloud diagrams in your workflow?
You have several options depending on your team's setup:
- PlantUML Online Server paste your code at plantuml.com and get an instant image
- VS Code extension install the PlantUML extension and preview diagrams inline while you edit
- CI/CD pipeline use the PlantUML Docker image to generate PNG or SVG files during builds and include them in documentation sites
- Confluence or Notion plugins embed live PlantUML diagrams that update when the source code changes
- GitHub or GitLab rendering some plugins render
.pumlfiles directly in repository views
If your team already uses PlantUML for other diagrams, check out the deployment diagram code examples for more ready-to-use templates you can adapt.
How do you handle more complex topologies like Kubernetes clusters?
Kubernetes adds layers namespaces, pods, services, and ingress controllers. PlantUML can model these through nesting:
@startuml

skinparam backgroundColor #FEFEFE


cloud "AWS" {

  node "EKS Cluster" {

    node "Namespace: production" {

      node "Pod" as pod1 {

        artifact "api:v2.3.1"

        artifact "envoy-sidecar"

      }

      node "Pod" as pod2 {

        artifact "worker:v1.8.0"

        artifact "envoy-sidecar"

      }

      node "Pod" as pod3 {

        artifact "redis:7.0"

      }

    }

  }

}


pod1 --> pod3 : Cache reads

pod2 --> pod3 : Queue processing

@enduml
This shows the cluster structure with sidecar proxies and shared cache pods. Adjust the nesting depth based on what you need to communicate you don't always need to show every pod.
What's a real-world example combining multiple services?
Here's a more complete setup resembling a typical SaaS backend on AWS:
@startuml

skinparam backgroundColor #FEFEFE

skinparam shadowing false


actor "Client App" as client


cloud "AWS Cloud" {

  node "Route53" as dns

  node "CloudFront CDN" as cdn


  node "VPC" {

    node "Public Subnet" {

      node "ALB" as alb

    }

    node "Private Subnet A" {

      node "ECS Fargate" {

        component "Auth Service"

        component "API Service"

      }

    }

    node "Private Subnet B" {

      database "Aurora PostgreSQL" as aurora

      database "ElastiCache Redis" as redis

    }

  }

  node "S3" as s3

  node "SQS" as sqs

}


client --> dns

dns --> cdn

cdn --> alb : HTTPS

alb --> "Auth Service" : /auth

alb --> "API Service" : /api

"API Service" --> aurora : Queries

"API Service" --> redis : Caching

"API Service" --> sqs : Async jobs

"API Service" --> s3 : File storage

@enduml
This diagram tells a clear story: client traffic resolves through DNS, passes through a CDN, hits a load balancer, and routes to either an auth or API service. Those services interact with databases, a cache, a message queue, and object storage. Any engineer can read this and understand the high-level infrastructure in under a minute.
Quick checklist for your next PlantUML cloud deployment diagram
- Define your scope first pick one environment (production, staging) and one region per diagram
- Use meaningful aliases
as apiis cleaner than relying on long display names everywhere - Nest nodes to show containment VPCs contain subnets, subnets contain instances
- Label every connection show the protocol or port so readers don't guess
- Add a legend if you use colors, stereotypes, or non-obvious symbols
- Keep
.pumlfiles in your repo next to your Terraform, CloudFormation, or Pulumi code - Split complex systems into multiple focused diagrams rather than one giant map
- Render in CI/CD so diagrams stay in sync with infrastructure changes
Start with one of the examples above, swap in your actual services and connections, and commit the file. You'll have a living infrastructure document that stays accurate because it's part of your codebase.
 Plantuml Sequence Diagram Code Examples and Syntax Guide
 Plantuml Class Diagram Syntax and Implementation Examples
 Plantuml State Machine Diagram Example for Real-Time Systems
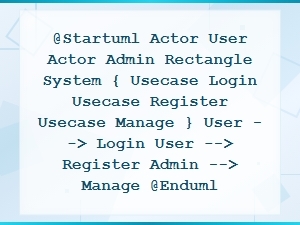 Plantuml Use Case Diagram Code Snippet Examples
 E-Commerce Website Database Schema Diagram Example with Tables and Relationships
 Beginner's Guide to Graphviz Dot Language Syntax